2019 School Climate & Connectedness Survey Results are Here!

By Jenni Lefing, School Climate and Conference Coordinator
Last week (April 22), school districts received access to their 2019 School Climate & Connectedness Survey results. This year, 31 districts administered the survey to transform school climate and strengthen relationships; factors linked to student success.
Over 40% of 3rd to 12th graders in Alaska participated in this year’s survey:

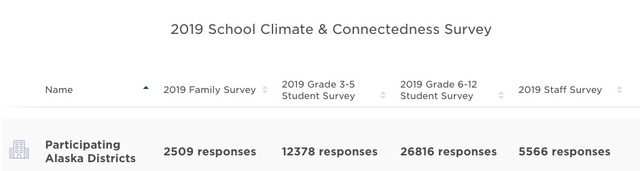
To Access 2019 Statewide Results go here: Alaska Statewide Link
Measuring school climate is a great first step to improving school climate outcomes. However, improving school climate is an ongoing process; one that takes time and requires the support of everyone within a school community.
To help districts in this process, since 2017, school districts are able to see their results in an interactive platform to truly interact with and better understand the data.
Through the platform, you can see student, staff, and family perceptions side-by-side, results for the past three years, comparisons for each school to state and district, how students responded to a question by sub-groups such as grade level, gender, race/ethnicity, and attendance, and opportunities for strength and growth across topics.
We recommend that districts follow these steps after they receive their results:
- Send out results to key stakeholders (to include district leaders, school board, school staff).
- Decide how and when stakeholders will review results. Districts that set aside intentional time for staff, school board members, district leaders, and others to review and have conversations round the results, identify focus areas, and create action steps are more likely to see improved school climate outcomes.
- Share action steps. Once action steps are identified, share and gather input on how steps can be implemented, and continue to visit these steps throughout the year.
Included with a district’s survey participation is tailored support from AASB to carry out these recommendations. This can include on-site workshops led by AASB staff to help board members, students, staff, and families use their data for planning. Video-conferencing is another way that AASB staff can help board members and district leaders to use results to make data-driven decision-making.
Many districts annually use findings from these workshops to help with strategic planning, board goal setting, and creating school improvement plans. One principal (after an on-site workshop led by AASB staff) said:
“Thank you for coming in and facilitating the conversation. We were able to have a deeper conversation when we developed our school action plan, so I know that staff was highly engaged and used the data to help us better serve.”
Districts are encouraged to have these workshops in the spring or early fall (such as during staff in-service), so the results can be a useful planning tool for the school year.
On a final note, School Climate & Connectedness Survey (SCCS) results are intended to give districts a “snapshot in time;” a glimpse into how students, staff, and family members were feeling about their school and community at the time of the survey. This “snapshot in time,” is a conversation starter to improve school climate. And, when looking at these results along with other data for your districts, such as attendance, graduation, and student assessments, you can have a more complete picture to make data-informed decisions.
Please do not hesitate to contact Jenni Lefing at jlefing@aasb.org with questions about the survey and to figure out how your district can make the most of your school climate data.
# # #