
Data is factual information (such as measurements or statistics) used as a basis for reasoning, discussion, or calculation. Alaska school districts collect many different types of data from a wide variety of sources.
Data collection tools include AASB’s School Climate and Connectedness Survey (SCCS), district attendance data, formative assessments, PEAKS testing, the Alaska Developmental Profile, the Youth Risk Behavior Survey (YRBS), and many others. Many districts also collect data from other sources, such as conversations with stakeholders about the quality of programs or other input about their work.
Interpreted thoughtfully, all of this information can tell an important story about students’ experiences at school.
Many districts and educators wonder, “How can we use the data we collect to help our schools better serve students?”

Why does using data matter?
Using data-informed decision making is an educational best practice because it leads to better outcomes for our students. Careful reflection and discussion of your data when making decisions can help a school district move from knowledge into action. When school boards, teachers, and administrators have reliable information on their students’ progress, needs, and perspectives, they can more effectively address those needs in and out of the classroom. Some data can be broken down by grade level, income, race, gender, or even by academic information such as grades, which can help school boards and school districts set priorities to improve outcomes for students.
Data can be used to:
- Address school climate needs for students, families, and school staff
- Track student attendance patterns
- Make decisions about school-funded programs
- Open up dialogues to better understand the needs, wants and priorities of students, families, and staff
- Prioritize staff professional development needs
- See gaps or strengths in services
- Better understand enrollment in advanced placement courses or extracurricular activities and who is or isn’t accessing them
- Show the relationships between student experiences and student outcomes

“Seeing the numbers is such a motivating confirmation that we really are making a difference”
-School District Family Engagement Staff
Collecting data about your district is just the first step. Using that data to shape conversations, engage in goal setting and strategic planning, and prioritize services and funds will truly allow you to maximize the impact you can have on all the students and families that you serve.
How can AASB help my efforts to use data for impact?

One Alaska school district learned that 60% of their students are experiencing trauma. They were seeing the side effects of this from quantitative data such as suspension, expulsion, and chronic absenteeism rates, as well as anecdotal stories from staff members. Some schools had already started to develop specific strategies to reduce student absences and suspension, however, there was no integrated plan across the district.
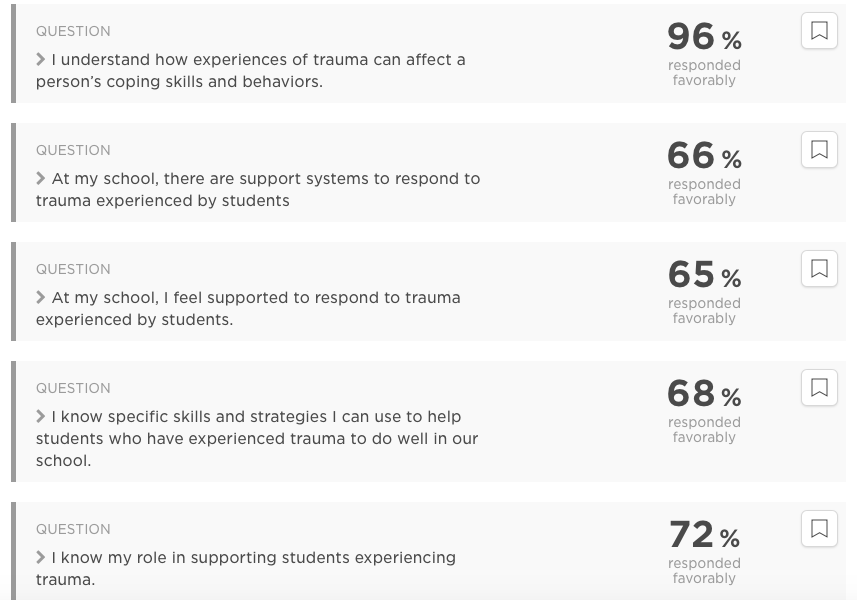
AASB added trauma engaged staff survey questions to the school climate survey in 2020, which showed that while over 96% of staff understood how trauma can affect coping skills, there was still a need to address other skills, strategies, and self-care tools for staff.
What does using data for impact look like in practice?
Developing a Data Profile: AASB can work with your district directly or refer you to organizations that can help you to take an intentional look at your data so it can be used to inform strategic directions or school action.
School Climate and Integrated Data Workshops: AASB hosts many different workshops using School Climate and Connectedness results or using school climate results alongside your other data sets. These workshops can be for school staff, school board, students, or community partners, and can be designed to set strategic priorities for your district, school, or classroom.
Dialogues and Focus Groups: AASB staff can host conversations or focus groups. These conversations can be an opportunity to better understand family, community, or student priorities in your district. These conversations can systematically organize ideas into themes and priorities for the district or for actions within a specific area of work.
Collecting Data: AASB administers the School Climate and Connectedness Survey. We can add unique questions to the survey as needed for districts. This data can help answer specific questions or priority work in a district. In addition to the SCCS, AASB can also support your district to develop surveys to collect other information.
Using this information, this district developed a plan with AASB to incorporate trauma-engaged practices using the Transforming Schools framework. By addressing the underlying trauma students were experiencing, the district was able to see a reduction in related issues such as chronic absenteeism. This is just one example of the many ways that a school district can utilize data in order to change the way they are able to serve their students and families and ultimately have a greater impact.
How do we get started?
While all Alaska districts collect data as a part of the various routine data collection activities implemented across our state, it can be difficult for many districts to figure out what to do with that data. Here are some suggestions for how to get started using a Data for Impact model in your district:
- Identify which data collection tools are used in your district as well as the timelines for collecting data and receiving results. Some commonly used data collection tools include: the School Climate and Connectedness Survey, attendance data, formative assessments for reading, the Alaska Developmental Profile, and community conversations.
- Develop systems and processes that allow stakeholders to access the data collected. We recommend reviewing relevant data quarterly and annually at a district level, school level, and classroom level.
- Engaging stakeholders from a variety of roles, ask questions about your data and allow for meaningful conversation:
- What does this data tell us?
- Who is impacted most?
- Why does the data look this way?
- What does this data tell us about those most underserved by our district?
- What other data could help us understand this information?
- What additional questions do we have?
- Use these conversations about your data to help support teacher, administrator, and school board reflective practice to create shared goals and responsibilities. These shared goals are most effective when current data is taken into account and used to set measurable targets for improvement. Questions to consider are:
- How does this data currently inform our goals and priorities?
- What do we want to do to shift this data?
- How will we know that we are making progress in the short-term?
- When will we come back to assess our progress?
- How do we make quality improvements to our approach?
- Use what you’ve learned and what you’re planning to mobilize families, students, staff, and community! Think about creative ways to share your data and your plans, such as developing a radio PSA, publishing a flyer, or hosting a public sharing session.
For more info
AASB is available to support all of the above activities. For more information, contact Alicia Duncan, Data & Evaluation Coordinator.

Alicia Duncan
Contact