Student Data Supports Need for Transformative Change

By Brian Laurent, DEED Data Management Supervisor
As about 8,000 students from the Aleutians to Annette Island, and from Anchorage to the North Slope, receive their diplomas and contemplate plans for life after graduation, we celebrate the accomplishments of our high school graduates. These students have excelled in academics, the arts, career and technical education, and athletics. They live in urban, rural, and remote Alaska. They attended large, comprehensive high schools and schools at which the graduating class can be counted on one hand with fingers to spare. These students inspire us and provide hope about the next generation’s ability to lead our great state.
Alaska’s system of public education has certainly worked for some students – but not all of them. It is a system with enduring achievement gaps in a state that does not compare favorably to other states in a country with subpar performance relative to other nations worldwide. Assessment results, the graduation rate, and chronic absenteeism are just three indicators of the need for transformative change to public education as shaped through Alaska’s Education Challenge.
Assessment Results
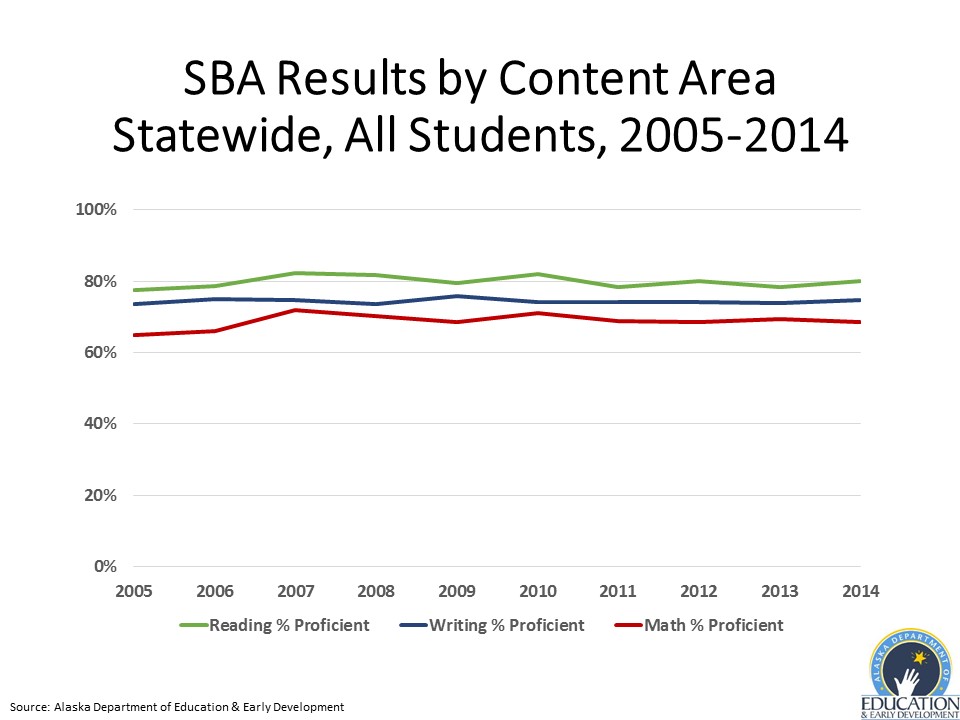
Each spring, students in grades 3-10 take a summative assessment aligned to state standards, the results of which are used for three key purposes: 1.) To inform stakeholders about how schools and districts are performing using a standardized measure; 2.) To identify schools with the most need of school improvement efforts; and 3.) To ensure educational equity in our state. Through 2014, the summative assessment taken by Alaskan students was the Standards Based Assessments (SBAs) in reading, writing, and mathematics. The SBAs were aligned to the Grade Level Expectations, or GLEs.
Statewide, student performance over a 10-year period on the SBAs was quite steady. In the final year of administration in 2014, proficiency was 80.1 percent in reading, 74.8 percent in writing, and 68.4 in mathematics in 2014.
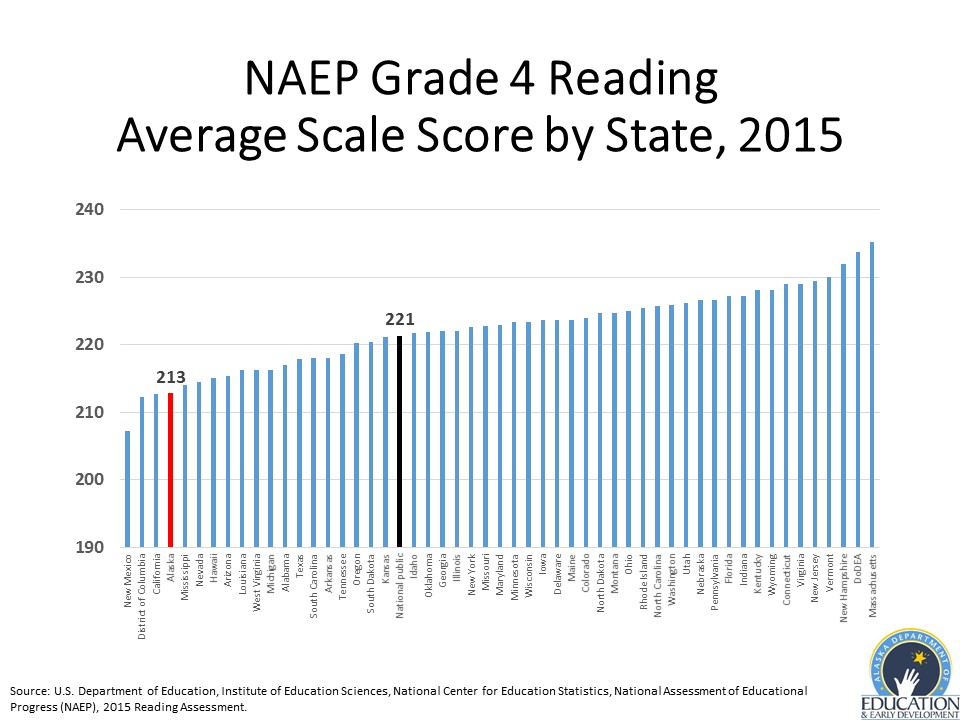
The challenge with the SBA trends, though, was the persistent disconnect between how the SBAs portrayed student achievement in Alaska and what was communicated by the National Assessment of Educational Progress (NAEP). Every other year, a sample of students in grades 4 and 8 take NAEP in reading and mathematics. In 2015, 29.9 percent of fourth-grade students and 31.4 percent of eighth-grade students were proficient in reading. Also in 2015, 35.1 percent of fourth-grade students and 31.8 percent of eighth-grade students were proficient in mathematics. Alaska’s NAEP performance consistently ranks poorly when compared to other states, particularly in grade 4 reading.
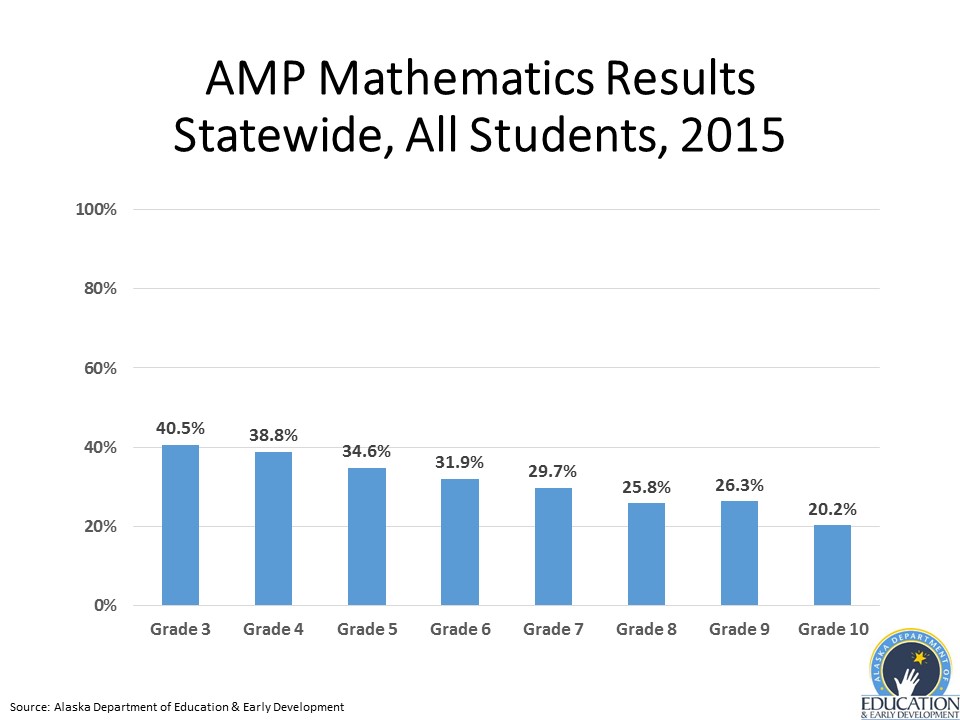
In 2012, the Alaska State Board of Education & Early Development adopted more rigorous standards in English language arts and mathematics. In 2015, students in grades 3-10 took the Alaska Measures of Progress (AMP) in English language arts (ELA) and mathematics, the first assessment aligned to the new standards. The portrait of student achievement painted by AMP was very different than the one painted by the SBAs, as 34.8 percent of students met the new standards in ELA and 31.2 percent met the standards in mathematics. Student performance on AMP varied by grade, with a clear pattern in mathematics of higher performance at the lower grades shifting to lower performance in higher grades.
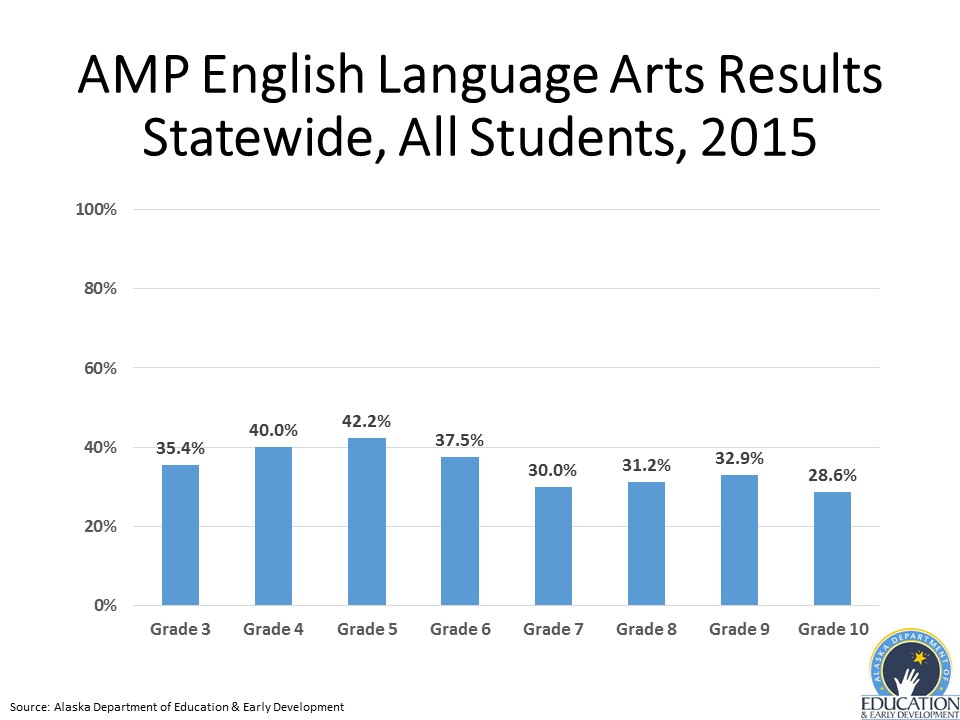
Performance was much lower in certain subgroups. Although lower than what parents, educators, and stakeholders had become accustomed to seeing, these statistics were much more closely aligned to NAEP performance.
(Assessment results from 2016 are unavailable due to the cancellation of assessments. In 2017, students took the Performance Evaluation for Alaska’s Schools, or PEAKS, assessment for the first time. Like AMP, PEAKS is aligned to Alaska’s English language arts and mathematics standards. Results will be available in August.)
Graduation Rate
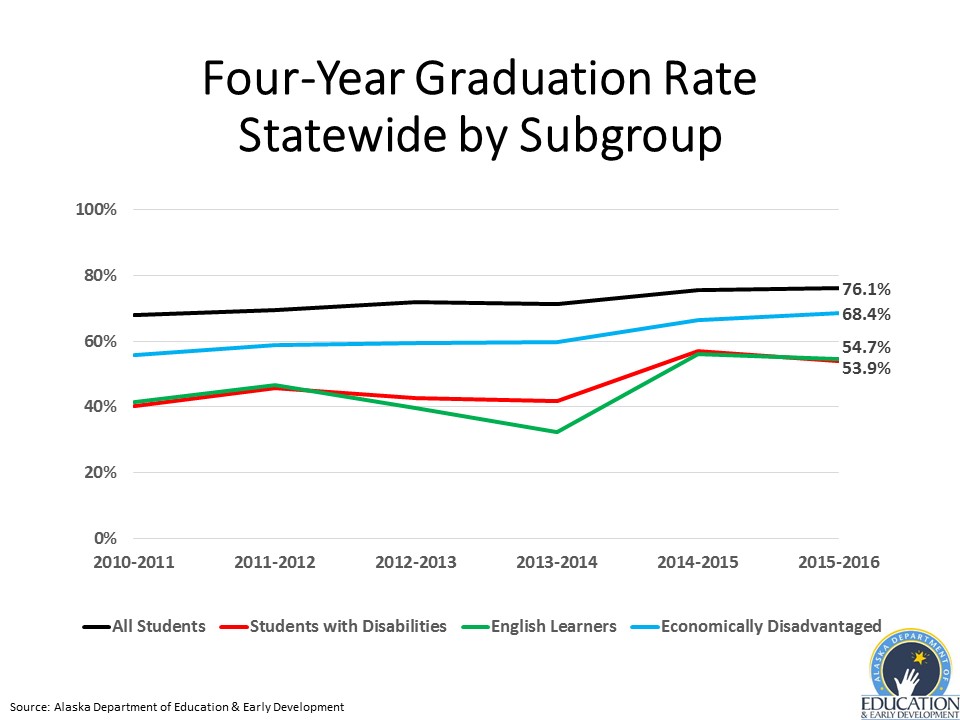
Although the four-year graduation rate has never been higher, recent increases should be viewed with caution considering the repeal of the High School Graduation Qualifying Examination (HSGQE) following the 2013-2014 school year. At 76.1 percent, the four-year graduation rate is still much lower than the statewide goal of 90 percent and is below the national average. Even with the repeal of the HSGQE, students with disabilities, English learners, and students who are economically disadvantaged graduate from high school at lower rates than all students statewide.
Chronic Absenteeism
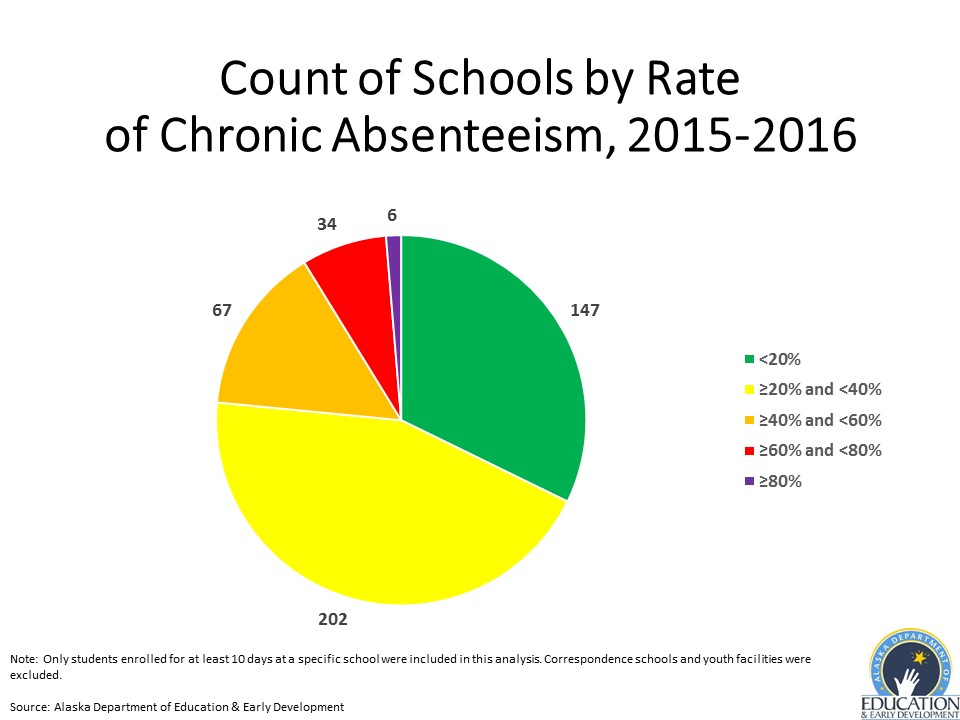
An additional challenge facing public education in Alaska is chronic absenteeism. The Alaska Department of Education & Early Development will begin reporting chronic absenteeism publicly following the 2016-2017 school year. A preliminary analysis of historical data reveals a stark reality. Over the past five years, one in four students was chronically absent, defined as students who were absent from school for at least 10 percent of the school days in which they were enrolled. (Only students enrolled for at least 10 days at a specific school were included in this analysis. Correspondence schools and youth facilities were excluded.) During the 2015-2016 school year, 26.4 percent of students were chronically absent, and nearly a quarter of schools had rates of chronic absenteeism that exceeded 40 percent.
It is true that students may be absent from school for myriad reasons; however, the relationship between student success and habitual absence from school should not be discounted.
Alaska’s Education Challenge
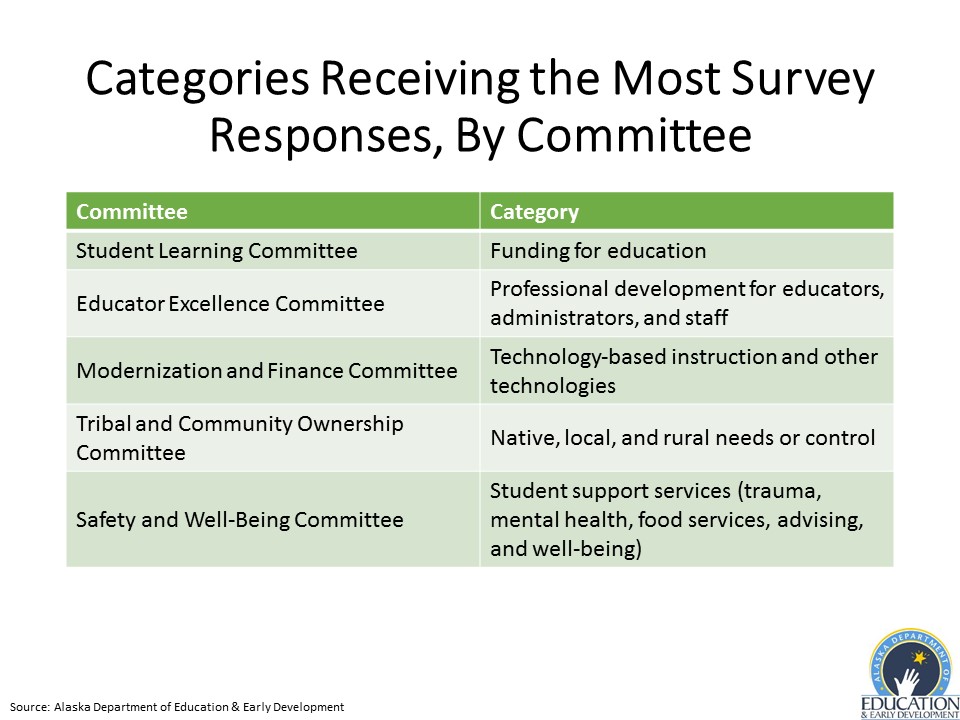
Student performance as determined by state and national assessments, a below-average graduation rate, and a high rate of chronic absenteeism reflect, in part, the impetus for Alaska’s Education Challenge, a comprehensive reevaluation of our state’s public education system. Through October, five committees of stakeholders from across the state will engage in conversations to generate recommendations for transformative, systemic change to public education in Alaska. The work of each committee is aligned to one of the State Board’s five strategic priorities.
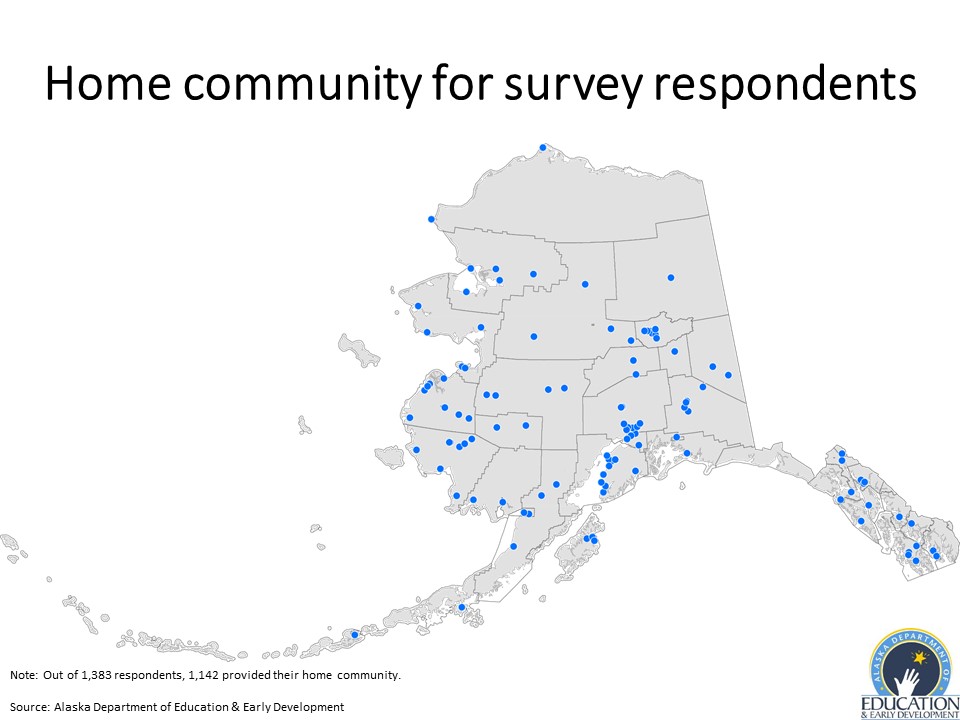
The first step in the Challenge was a survey of Alaskans to determine ideas for topics to be discussed by the committees. The response was overwhelming. Nearly 1,400 Alaskans from 109 communities provided over 18,000 ideas, which will inform the work of the committees in the months ahead.
We should be dissatisfied with the status quo. But Alaskans are clearly optimistic there are solutions that fit our state’s unique context – solutions that will help ensure every student receives an excellent education every day and is prepared for their chosen path after high school.
For more information about Alaska’s Education Challenge, please visit https://gov.alaska.gov/administration-focus/alaskas-education-challenge.
The views expressed here are the writer’s and are not necessarily endorsed by the Association of Alaska School Boards. AASB welcomes diverse perspectives and civil discourse. To submit a Guest Column for consideration, see our Guest Column Guidelines and email your 400-1000 word submission HERE.